
REVISIONIST

In June, students finished reading George Orwell's masterpiece, Animal Farm. Each week students were formally assessed through written quizzes. Summative assessment of the novel took the form of a project titled REVISIONIST. The end of Animal Farm coincided with lessons on cause-effect essays which helped inform the structure of the project. A PDF of the project overview handout may be downloaded by clicking HERE.
The objective of REVISIONIST was for students to create an infographic that illustrated one of the key events of Animal Farm and then to revise it to create an alternate telling. The primary learning objectives were as follows.
Demonstrating Understanding
demonstrate understanding of a variety of texts by summarizing important ideas and citing supporting details
Organizing Ideas
identify and order main ideas and supporting details and group them into units that could be used to develop several linked paragraphs, using a variety of strategies and organizational patterns
Producing Media Texts
produce a variety of media texts for specific purposes and audiences, using appropriate forms, conventions, and techniques
In addition, students improved their visual literacy and learned about symbolism to aid the visual element of their infographics. From brainstorming to final oral presentations, the project took three weeks.
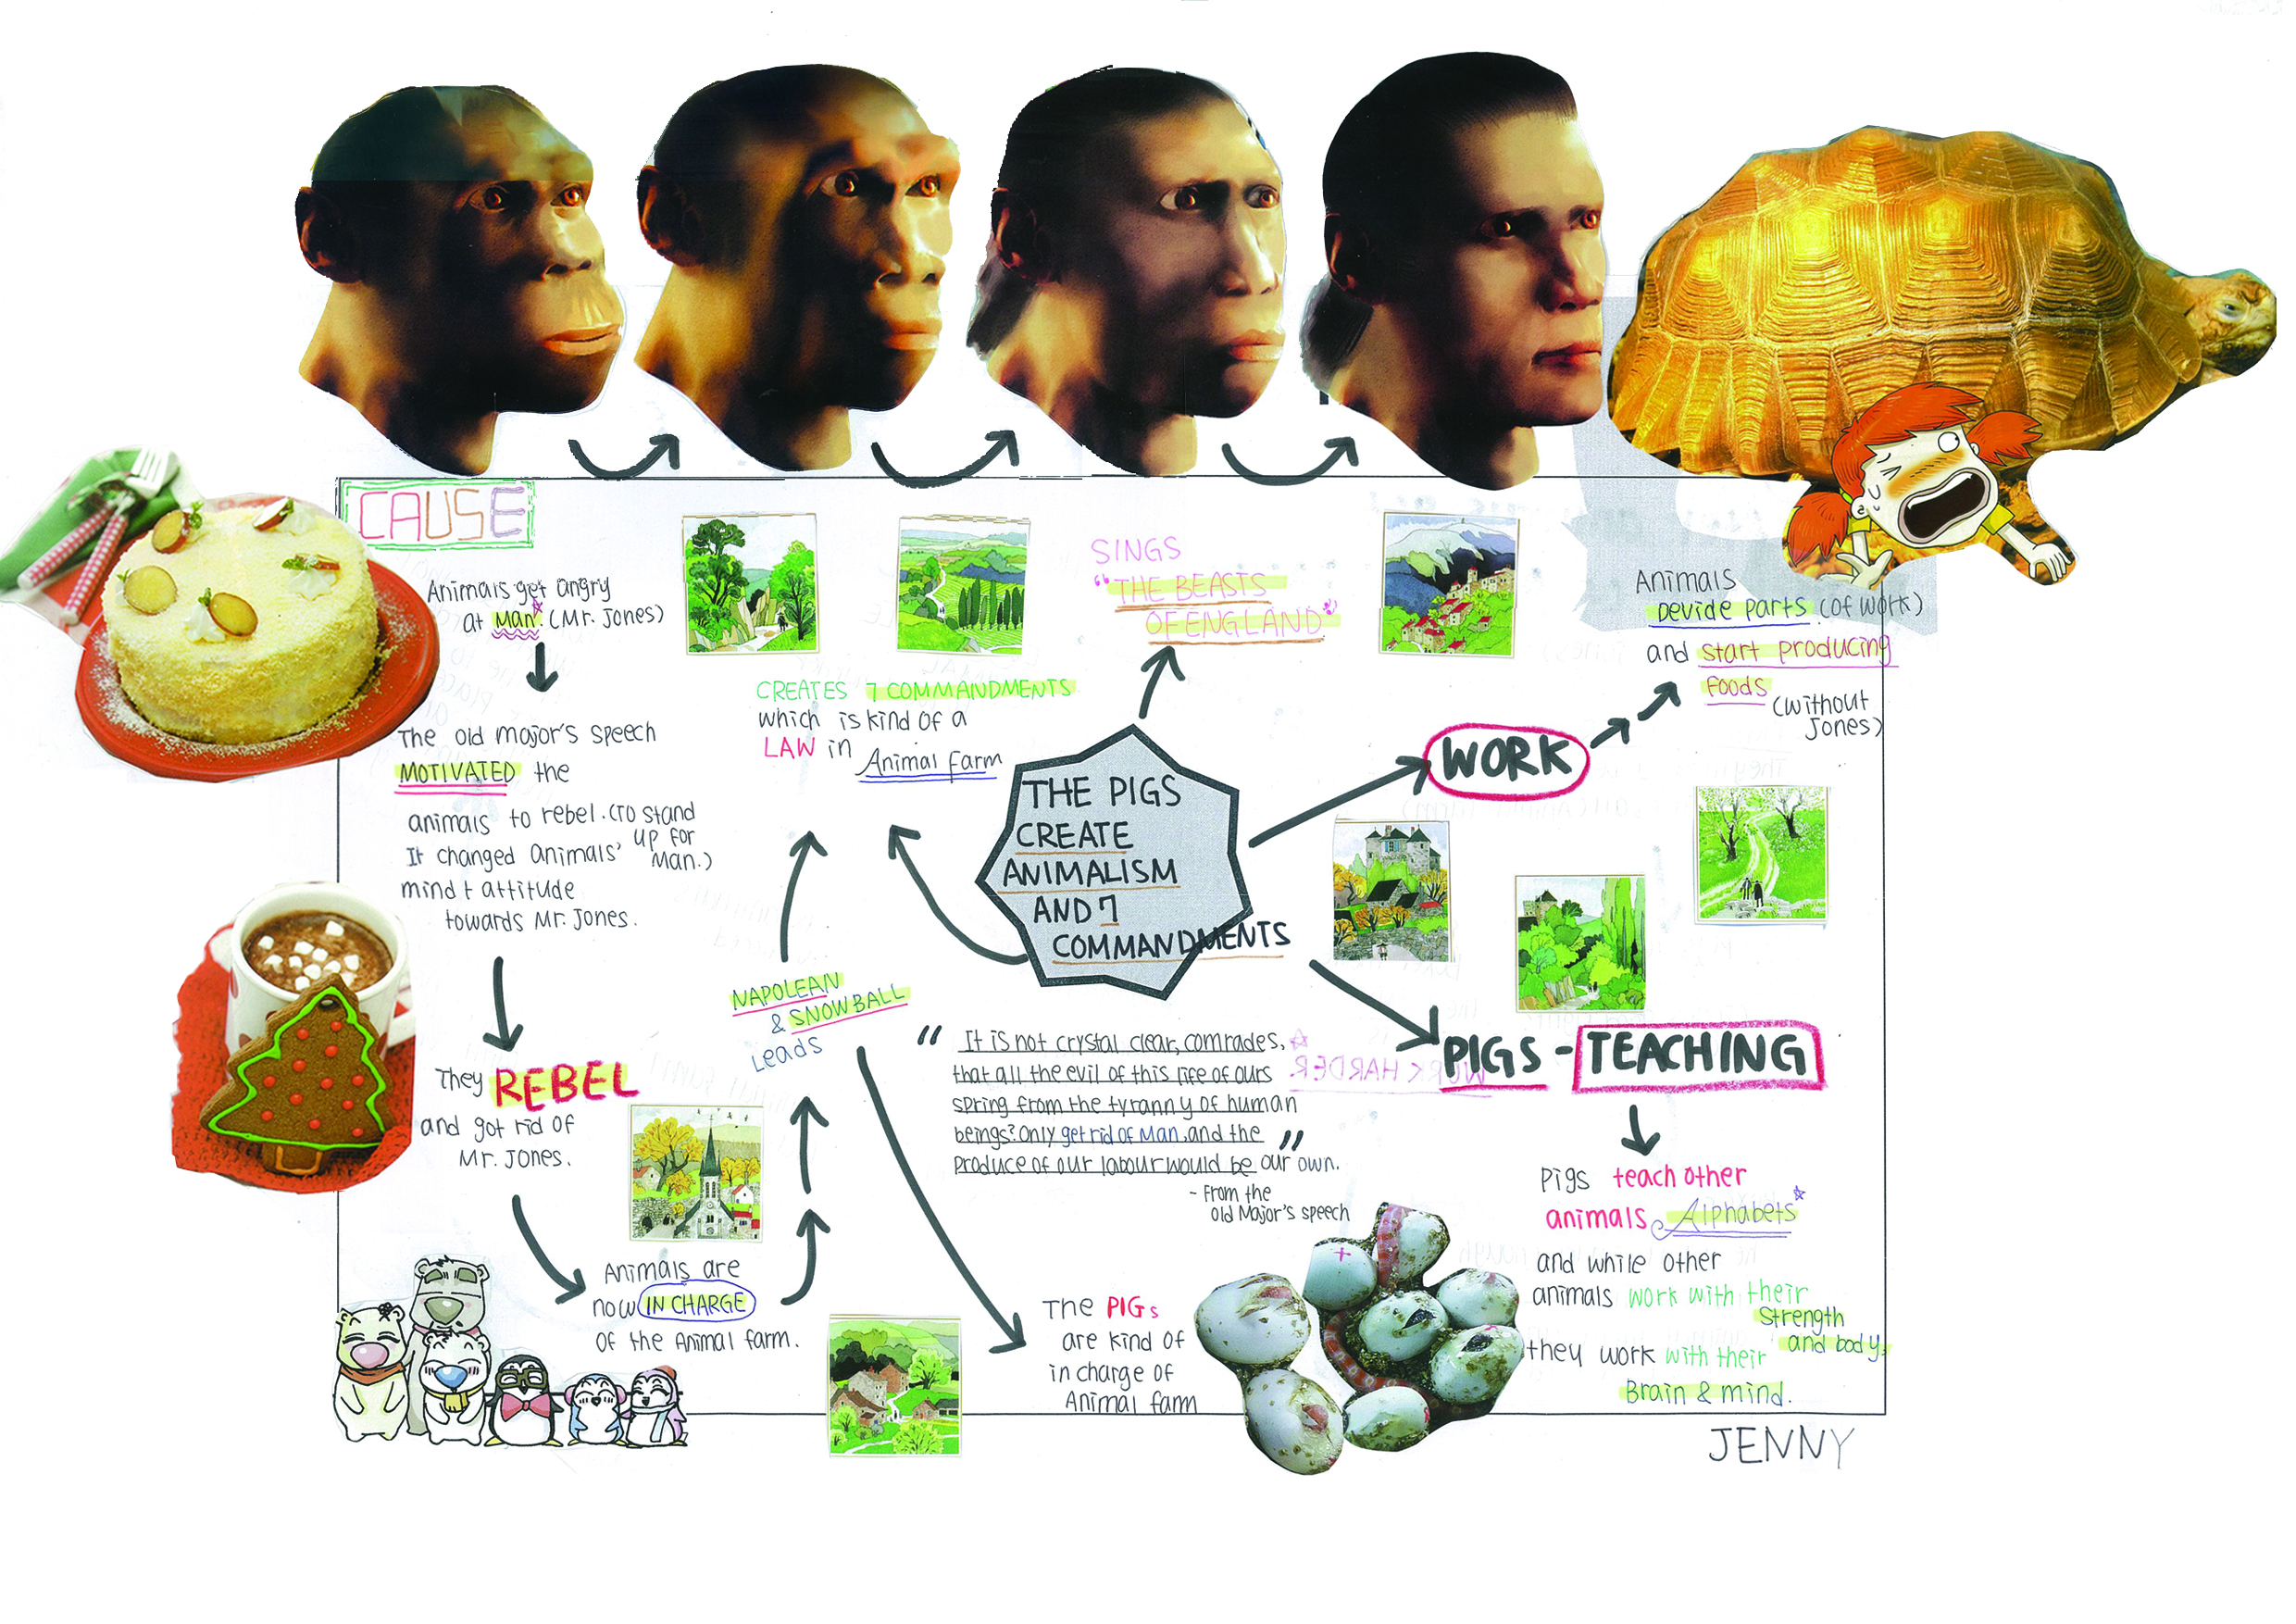
Park, Jenny REVISIONIST
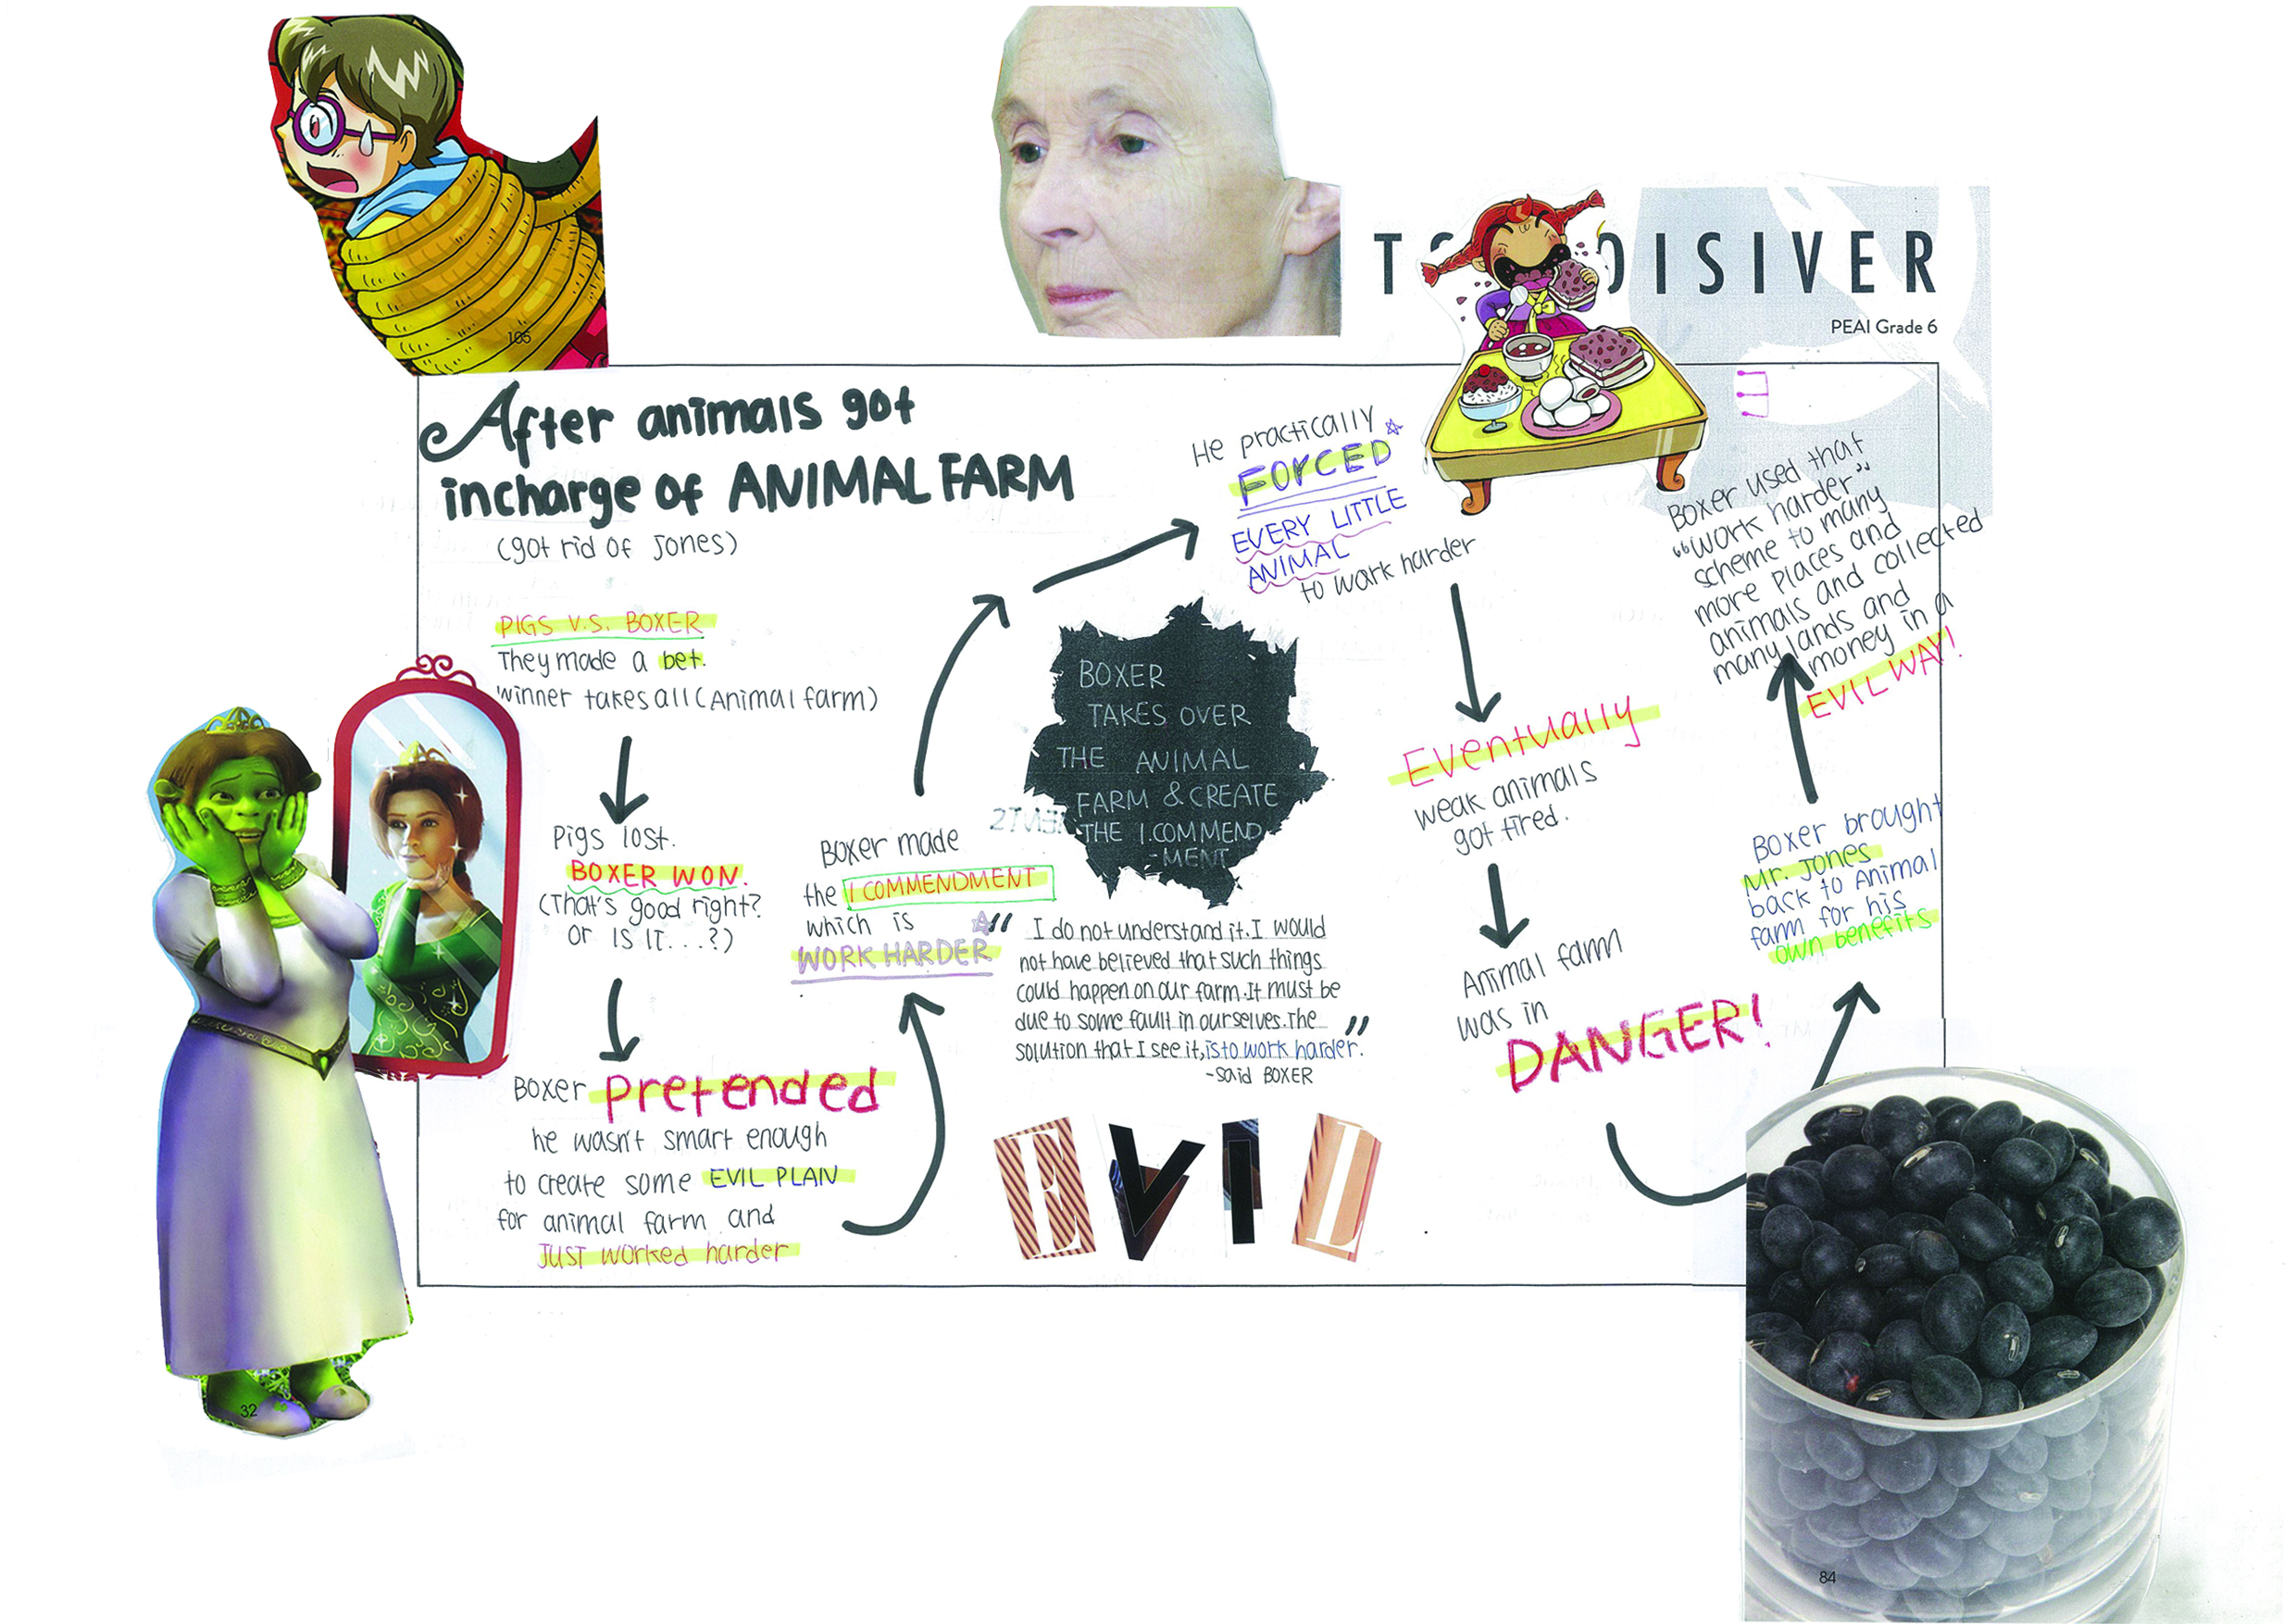
Park, Jenny TSINOISIVER
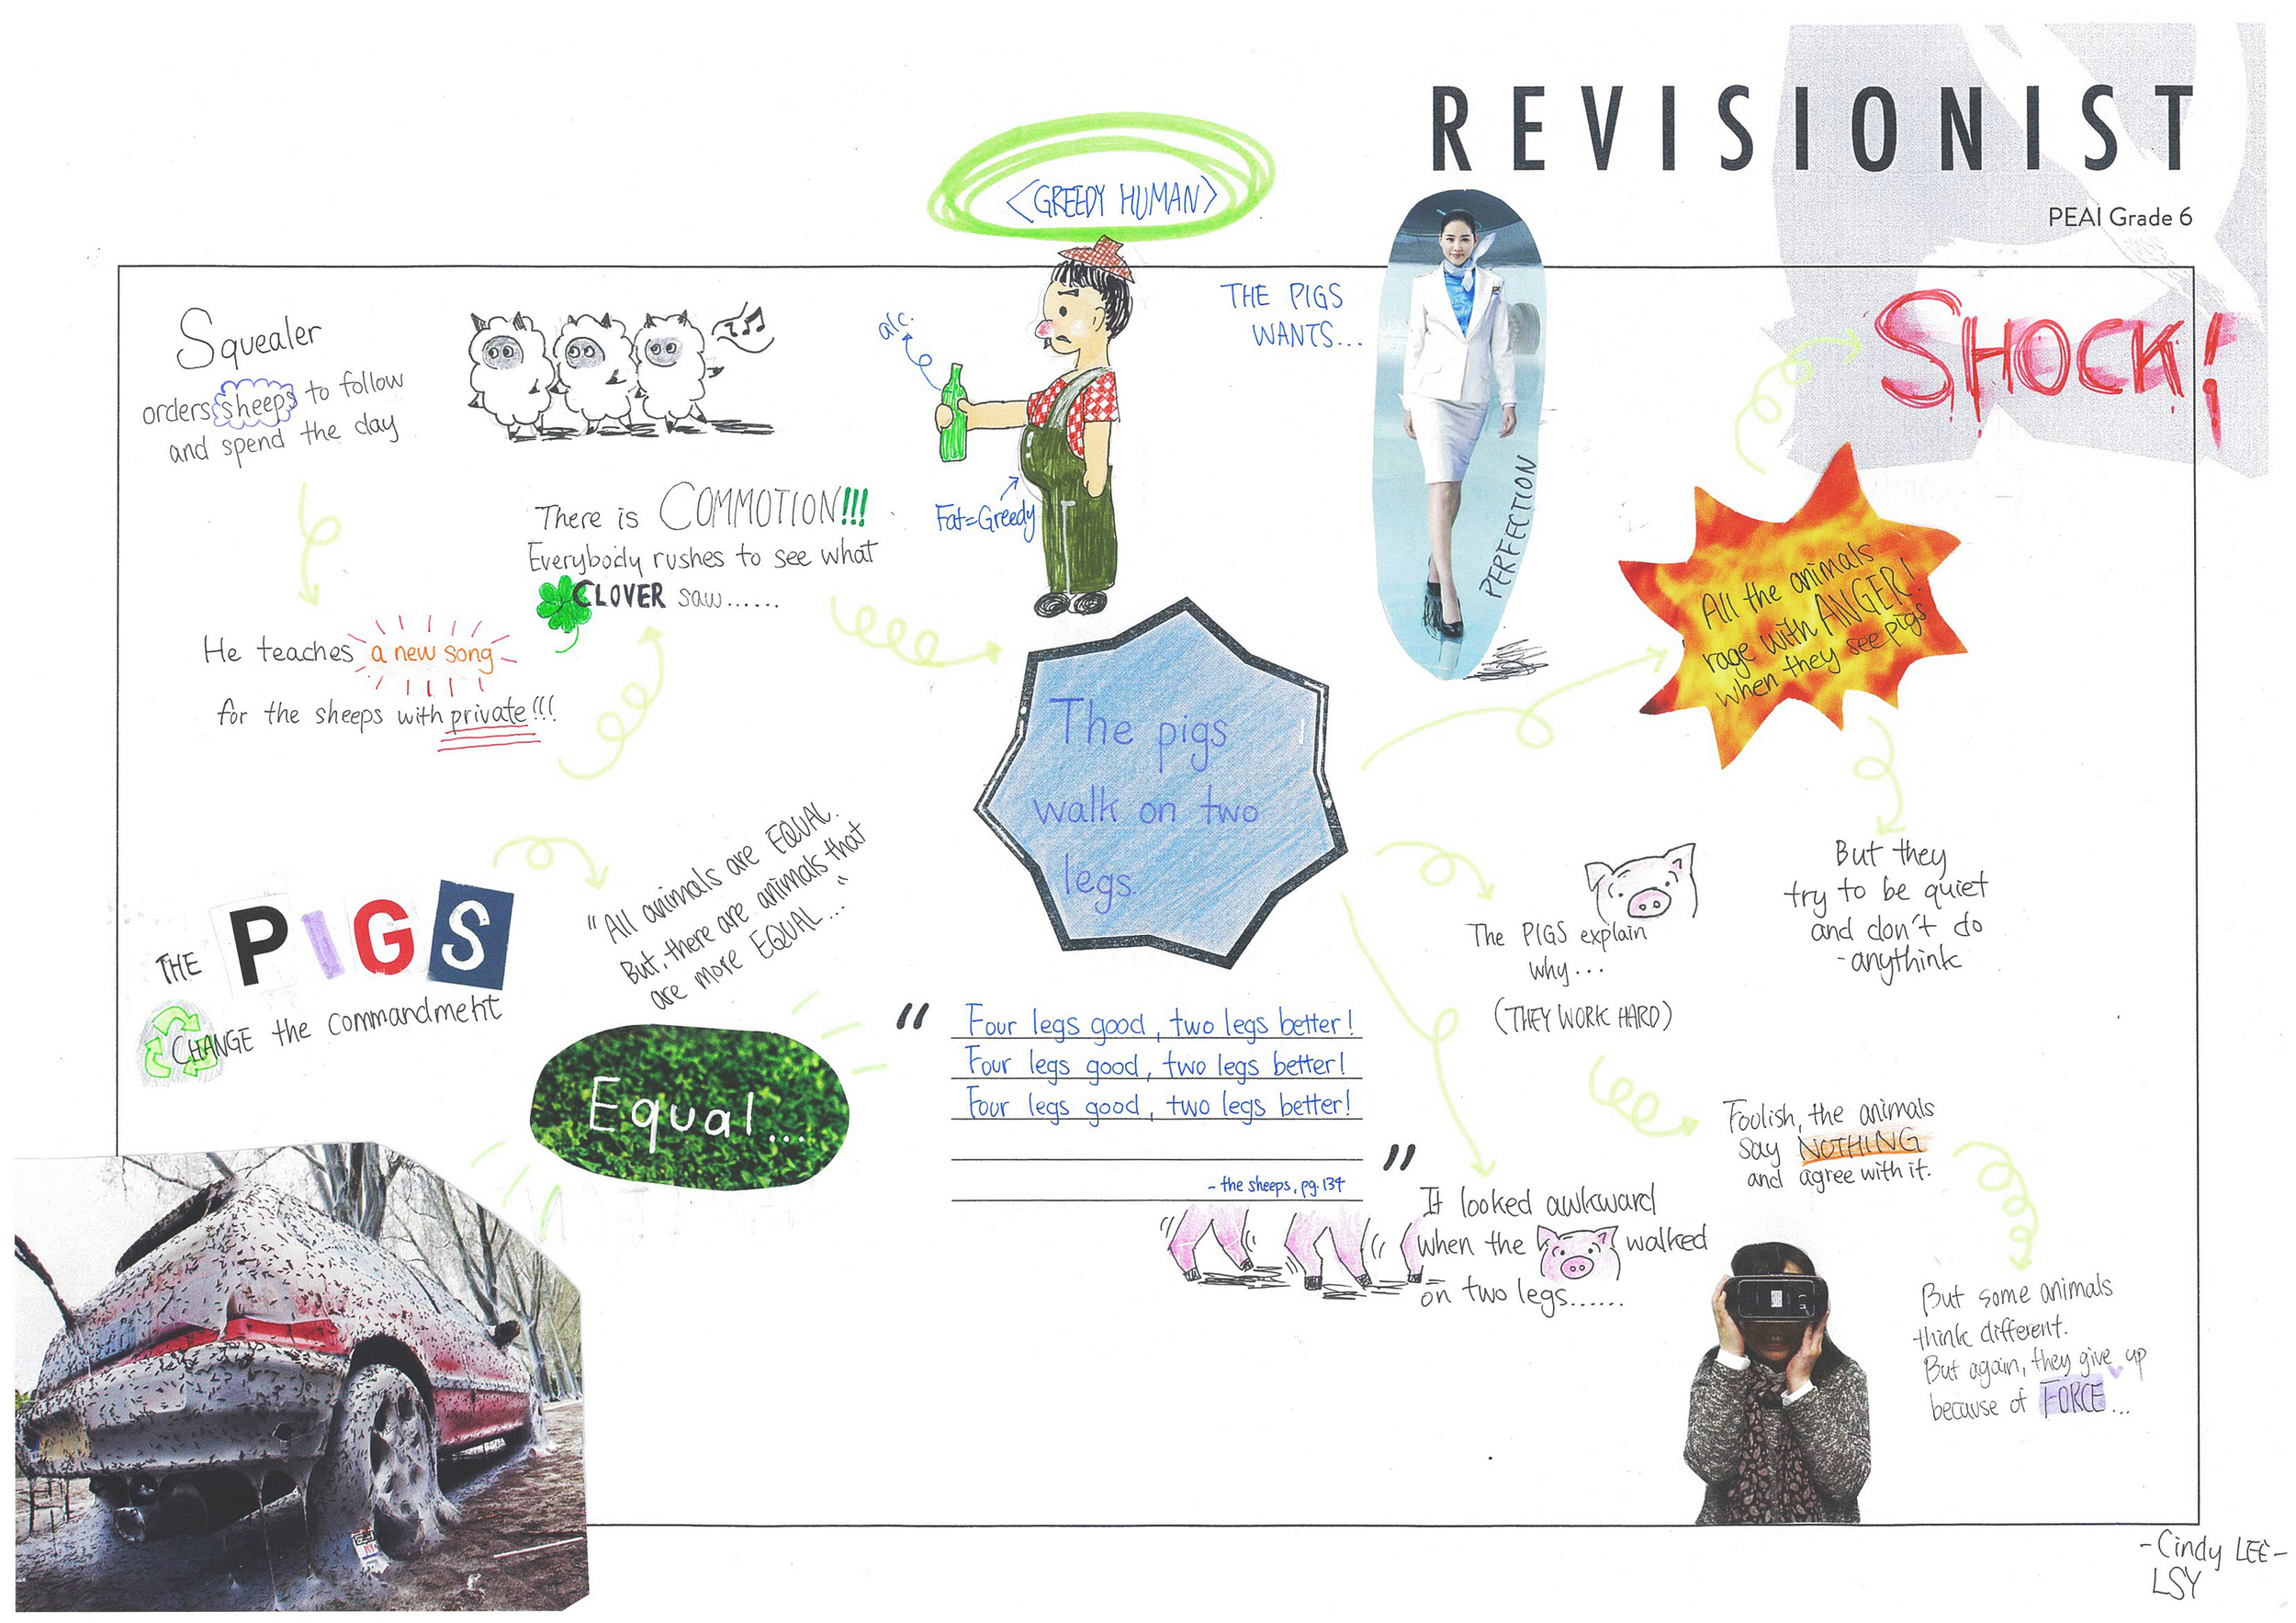
Lee, Cindy REVISIONIST

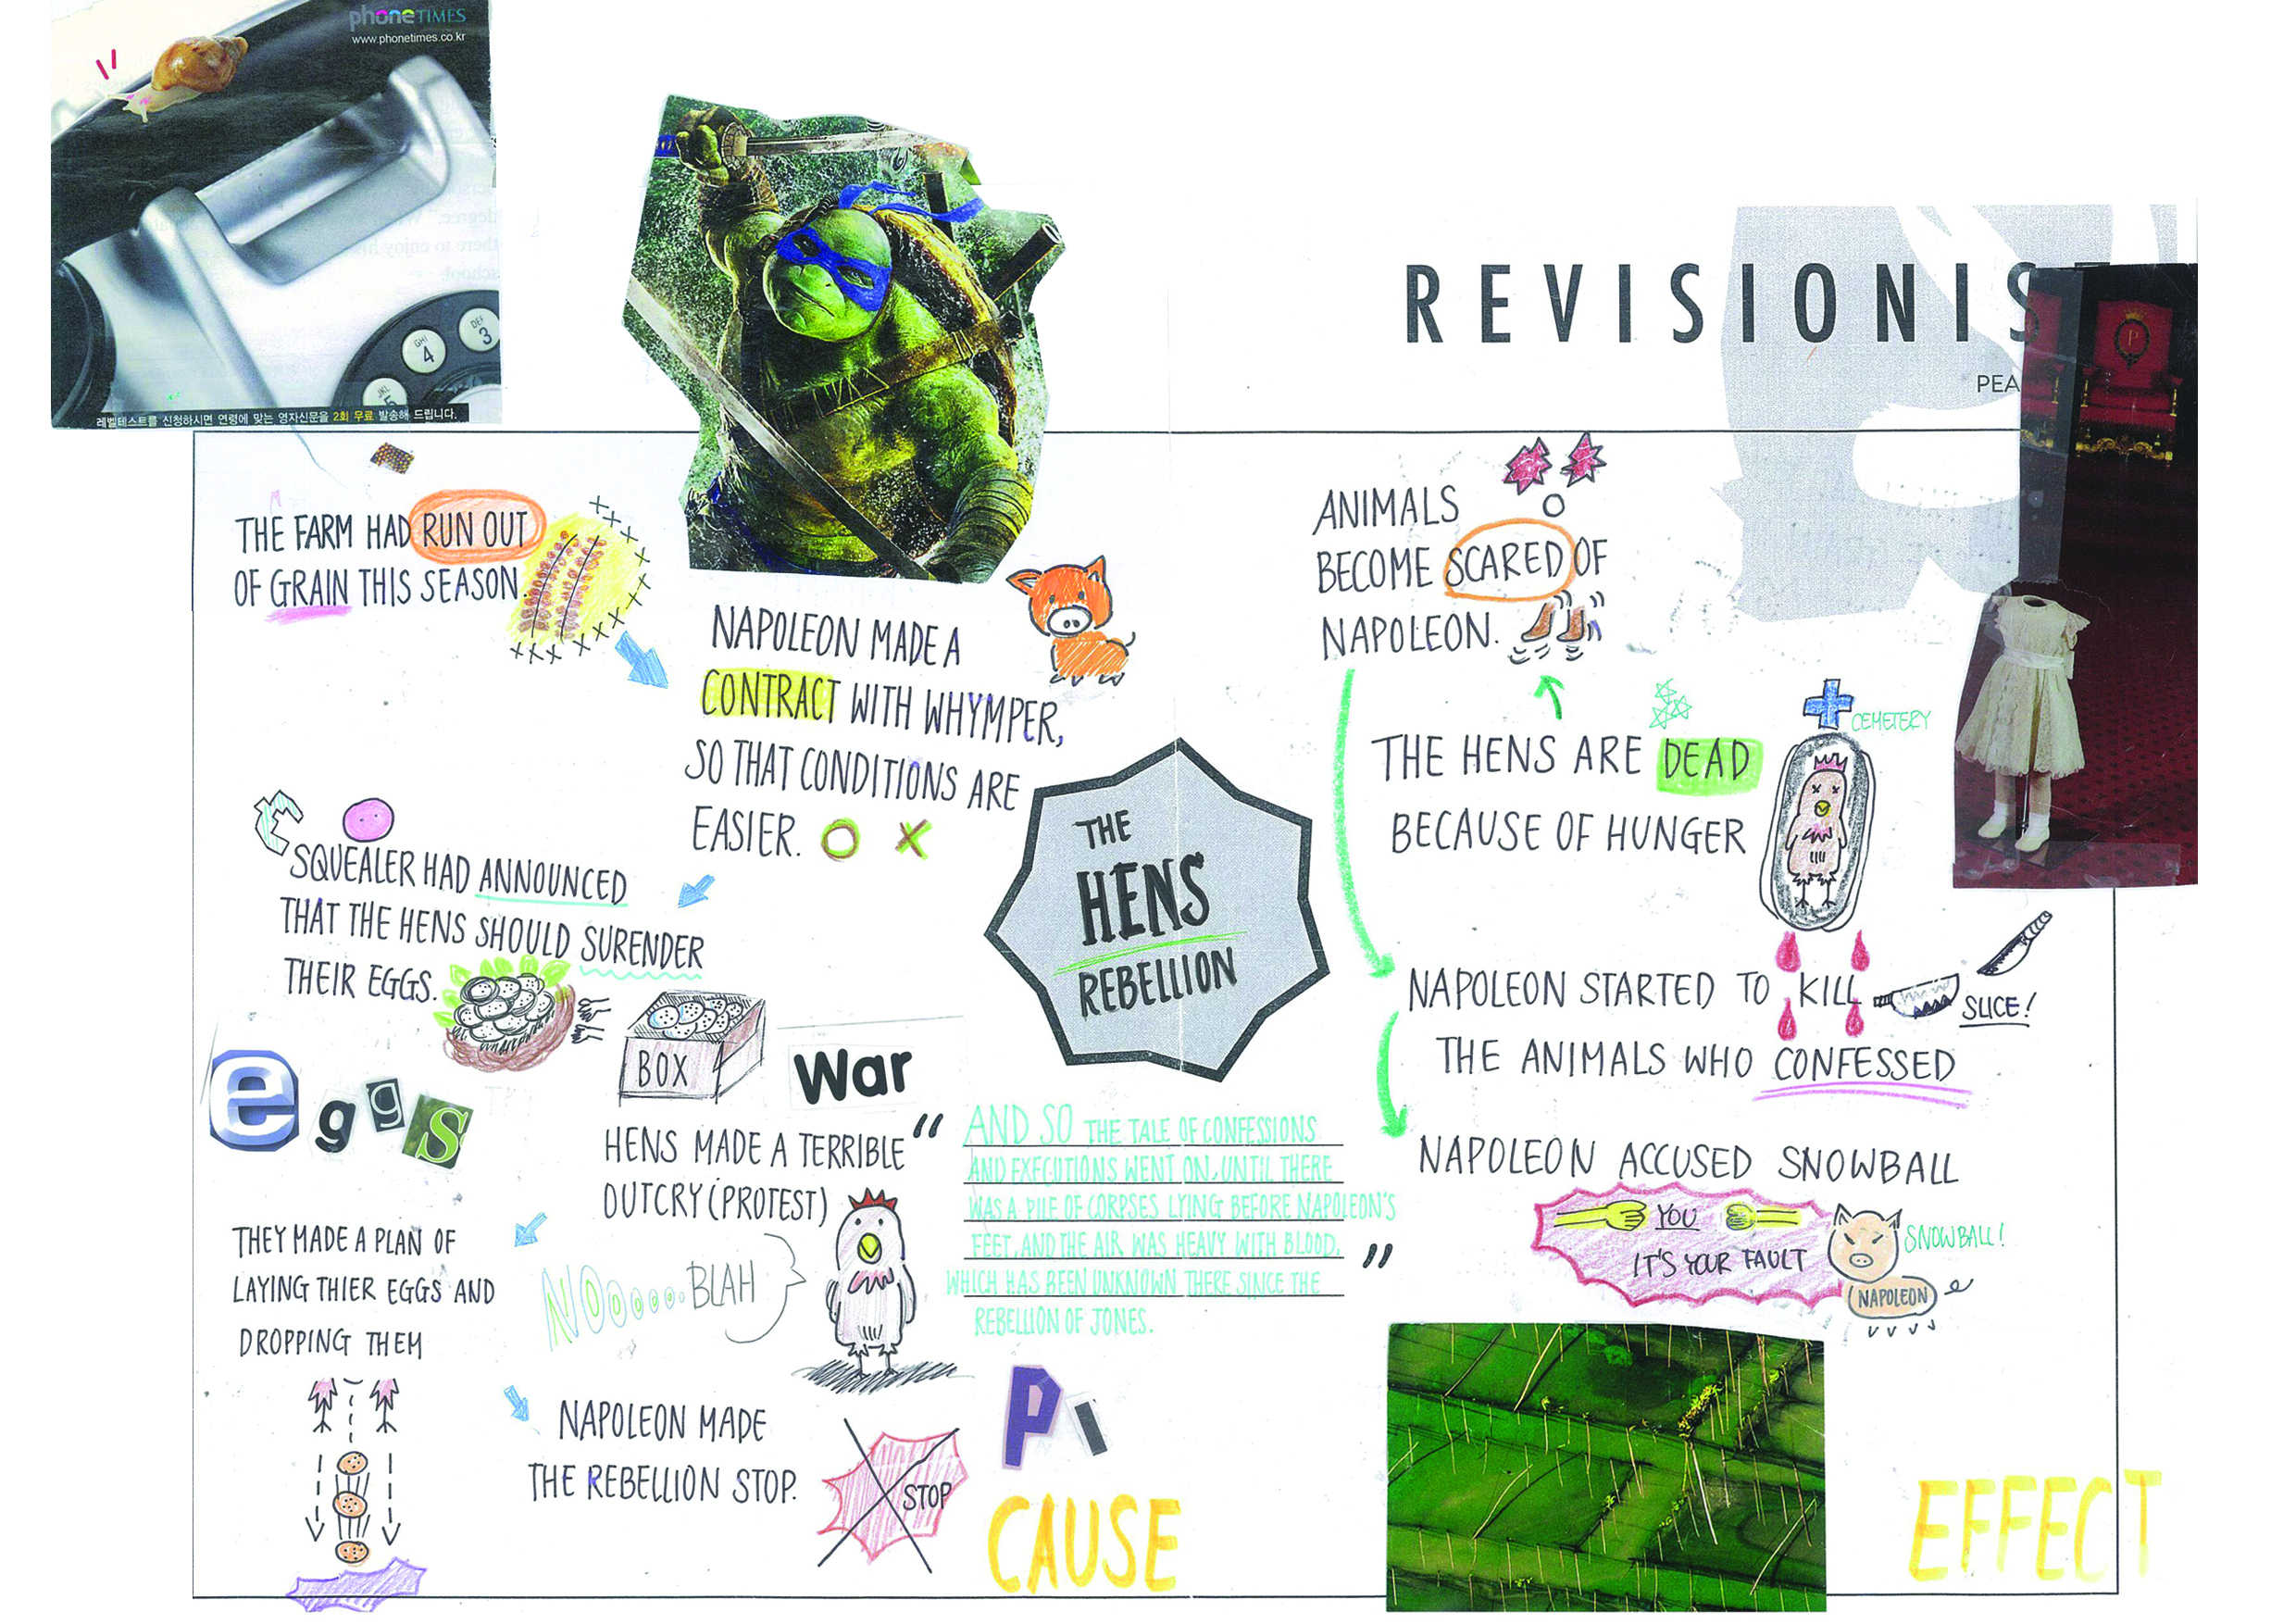
Lee, Cindy TSINOISIVER
Kim, Sarah REVISIONIST

Kim, Sarah TSINOISIVER
Animal Farm is structured as a narrative which made the textual element of the infographic deceptively difficult. Identifying causes and effects that were sometimes two or three steps removed from a key event proved a challenging task. In students' initial drafts, my feedback was frequently focused on re-orienting students away from chronological sequencing to cause/effect sequencing. This structuring was reinforced when students created their alternate telling of their key event.
I was pleasantly surprised at the depth of thought that went into students' visuals. They were given limited resources (i.e., Forbes Asia, National Geographic) to find appropriate visuals which forced them to make some creative choices. There were few literal representations of story events.
Students presented their infographics from June 27 to 29. In order to show recognition for outstanding works, students voted for their peers in three categories: Most Beautiful Infographic, Most Engaging Presenter, Best Overall Presentation. The results are below:
BM1
- Most Beautiful Infographic: Kang, Alex
- Most Engaging Presenter: La, Hoik
- Best Overall Presentation: Kang, Caillou
BM2
- Most Beautiful Infographic: Shim, Ashley
- Most Engaging Presenter: Kim, Sara
- Best Over all Presentation: Park, Joshua
BT1
- Most Beautiful Infographic: Kang, Emily
- Most Engaging Presenter: Kim, Greg
- Best Overall Presentation: Park, Ariel
BT2
- Most Beautiful Infographic: Park, Jenny
- Most Engaging Presenter: Kim, Chansu
- Best Overall Presentation: Kim, Sarah
BW1
- Most Beautiful Infographic: Kim, Ian
- Most Engaging Presenter: Pyo, Michael
- Best Overall Presentation: Park, Alize
The project was a great way to start the summer and wrapped up Animal Farm in a memorable way.
-Brenden